(253) 302-4847  ·  Tacoma      (253) 844-4289  ·  Lakewood

Blog  ·  April 14 2020

How's the Market? March 2020

Impacts of Covid-19

When we started posting market updates, we never dreamed we’d be sharing data around an event like this. As you have likely heard, real estate was deemed essential after a few weeks of anticipating whether we were going to be on or off. For now, our brokers are allowed to operate under strict guidelines. You can read about those HERE.

It’s hard to know where the Covid-19 crisis will take us, so we are doing our best to adapt week-to-week. Last month I was looking at opportunities in the market; this month I am just going to provide an overview of where we were at on March 30th, 2020.

PIERCE COUNTY / TACOMA DATA

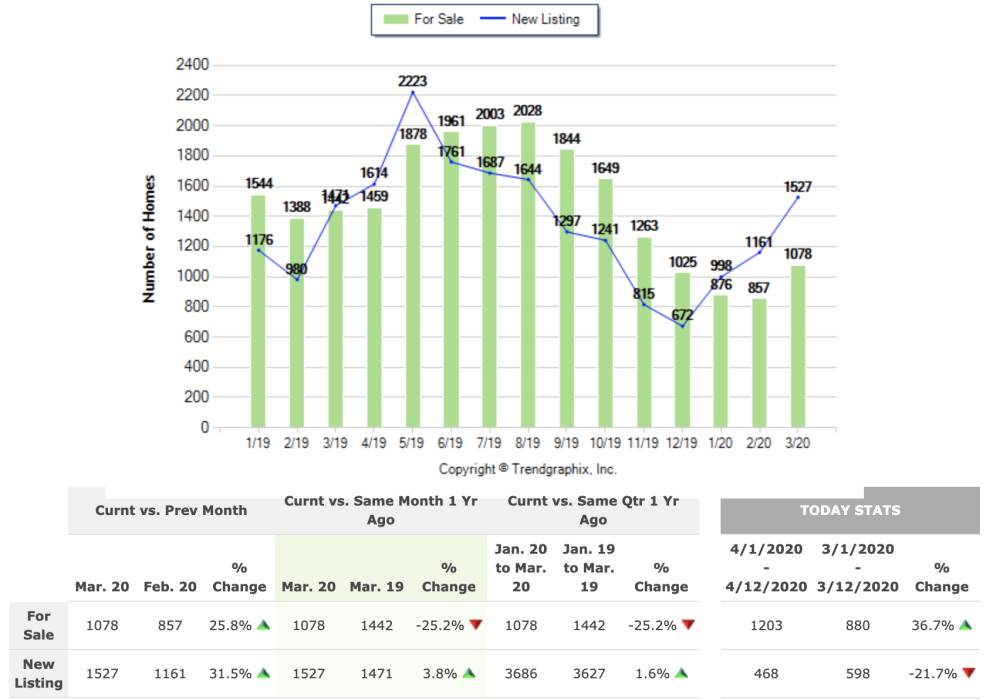
All of the uncertainty in March led to an influx of listings going on the market in Pierce County. Take a look at the graph below:

This graph represents Pierce County and the new listings that went on the market in March, and the homes that were on the market for sale at the end of the month. As you can see, there are homes still on the market, and compared to last year there was a 3.8% increase in new listings for the month of March.

Since we were in a housing shortage prior to the Stay At Home order, the new listings were a welcome sign to buyers. This does not mean we are out of the woods, however. The number of homes for sale show we are down 25.2% homes available on the market, when comparing March 2020 to March 2019.

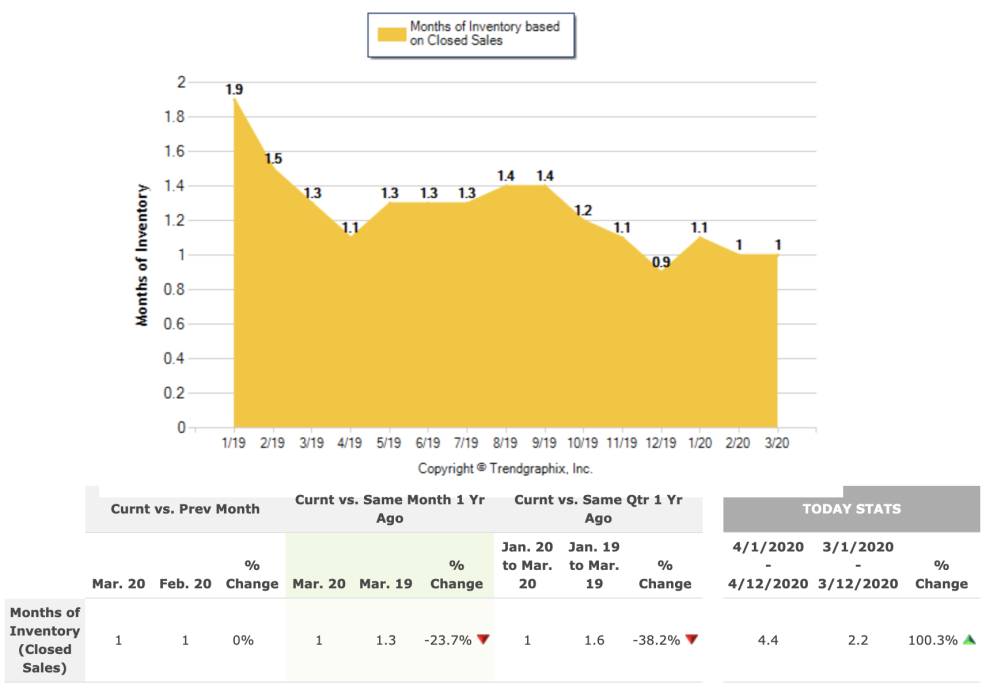
Take a look at the graph below that shows the months of inventory:

Last month shows we are still at one month of Inventory, which indicates a seller’s market. The interesting part about this graph is the fact that in March of 2019, the months of inventory was a higher number than March of 2020.

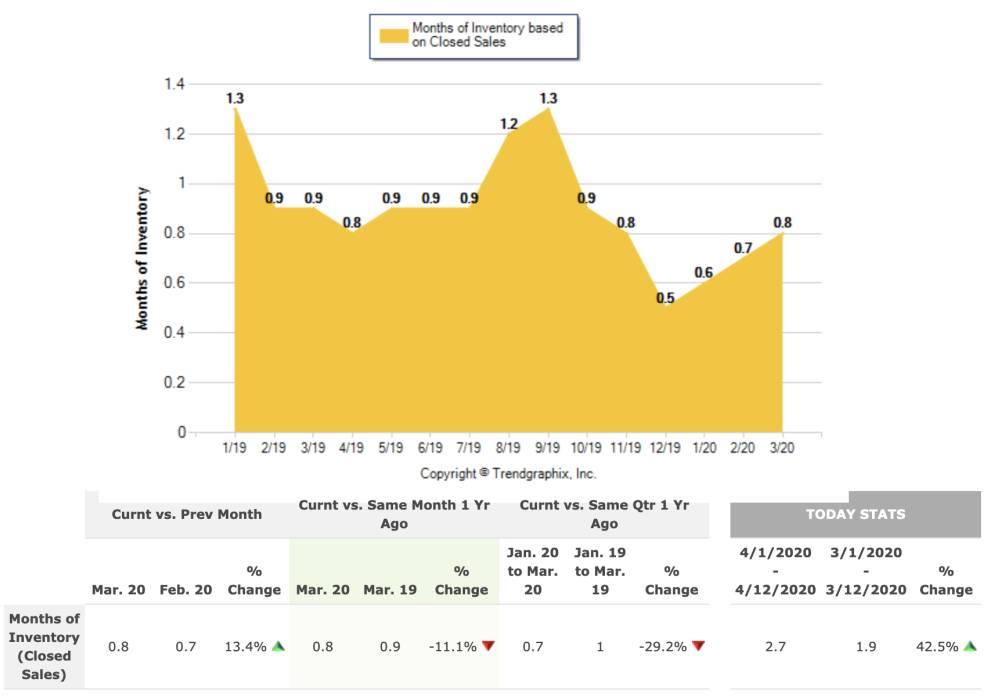
Speaking of months of inventory, let’s take a look at the Tacoma’s months of inventory:

While Tacoma’s months of inventory is extremely low (a balanced market is considered 3 to 6 months of inventory), you can see the upward trend, which predated the COVID-19 crisis. Will this make the number increase even more? That’s certainly what we’re seeing in the daily counts.

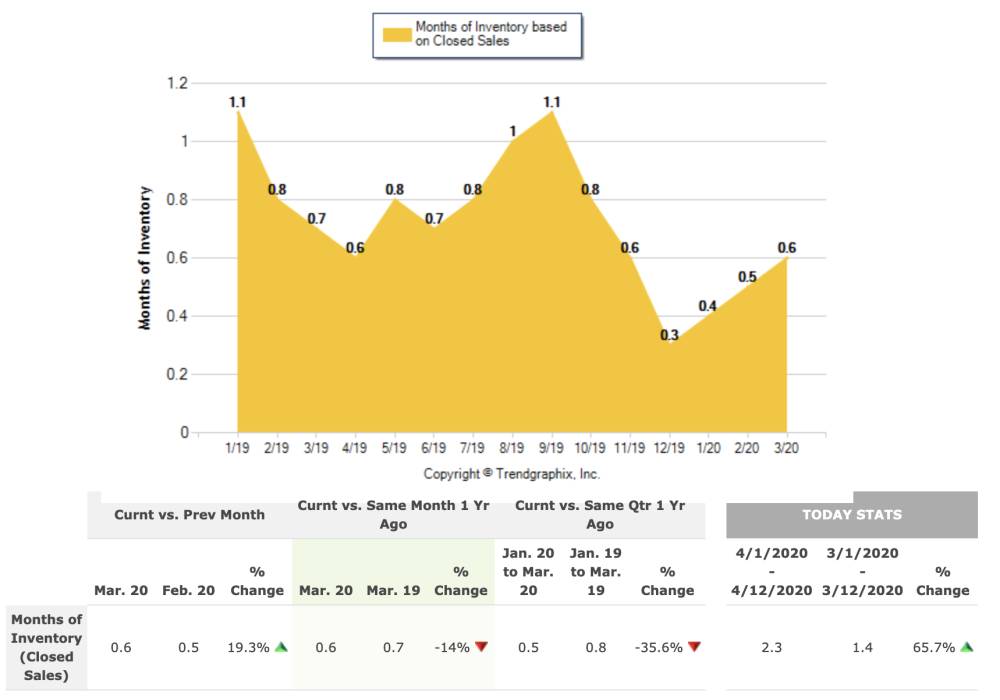
Breaking things down further, let’s take a look at the sub $500,000 months of inventory in Tacoma:

As you can see, the sub $500,000 market for homes in Tacoma still has a major inventory shortage, and homes continue to sell. Sharing the same trends with Pierce County at large, the months of inventory is lower than March of 2019.

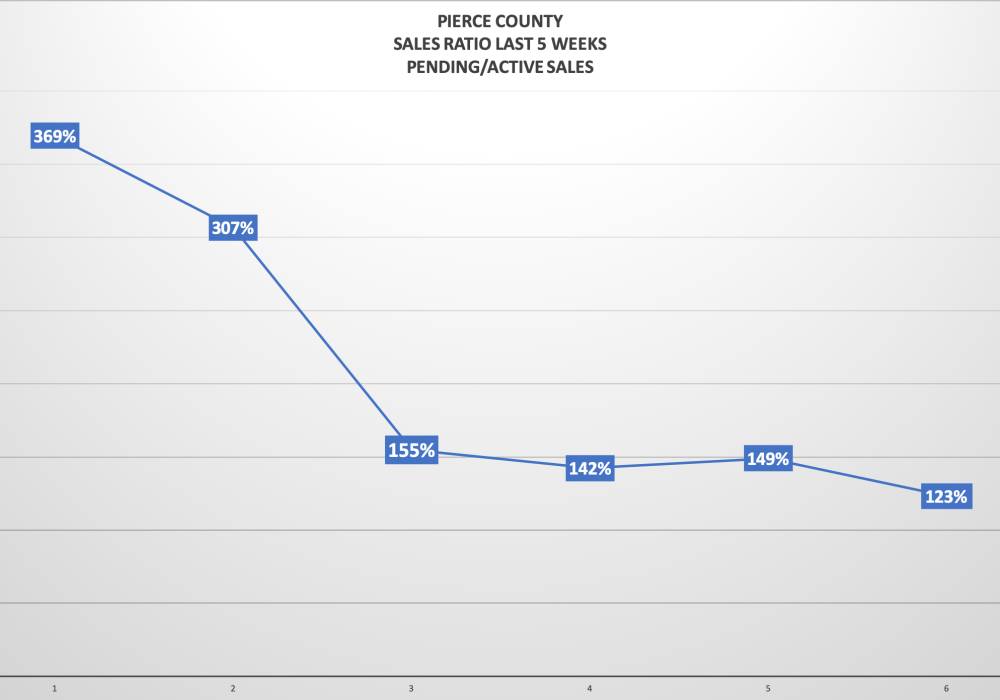
But what about the current data? Things continue to evolve from week-to-week. Let’s take a look at a weekly breakdown:

What you see is the sales ratio (pending properties divided by active) for the last 5 weeks in Pierce County. 55% is considered a balanced market, and Pierce County is well above that, making it a seller’s market strictly by the numbers. How much further will the sales ratio go?

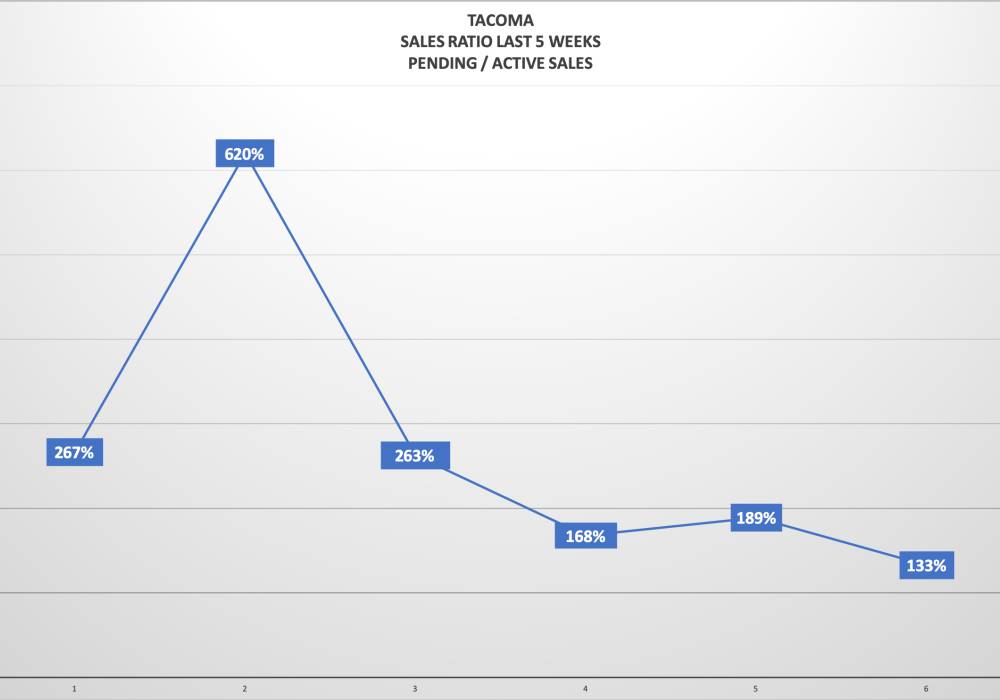
Now let’s take a look at Tacoma’s sales ratios over the last six weeks:

While the numbers up top for March show one story, the weekly numbers tell another. Both the Pierce County and Tacoma sales ratios (or put another way - the likelihood of selling) have downward trends dating back six weeks.

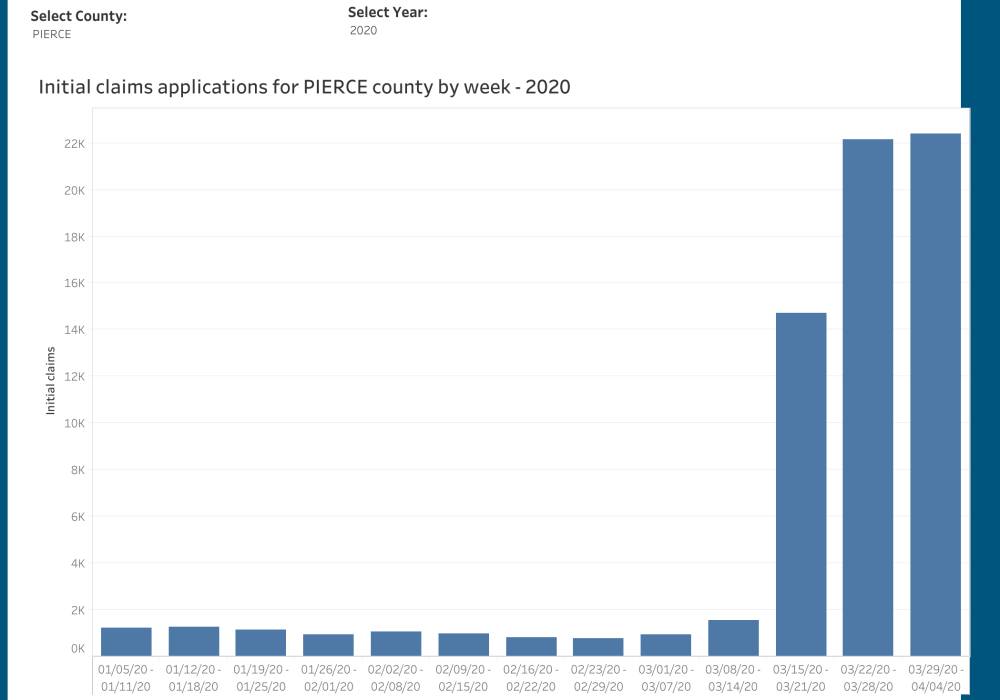
Another piece of interesting information is the unemployment data for Pierce County. Take a look at the number of unemployment claims (according to Employment Security Department) due to the COVID-19 Pandemic/Stay At Home order:

As expected, you see the number of unemployment claims has increased week over week as we have stayed home to protect ourselves and others. Take from this data what you may, we think it is important you know the numbers and their potential impacts on you, positive or negative, so you can make the most sound decision possible.

If you would like more detailed graphs on the past six weeks, get in touch with us on the for more data on the market. They are well equipped to answer your questions and serve you!

Please stay safe, stay healthy, and stay home. Let’s beat this thing TOGETHER!