This year especially, we have followed housing data in the micro; a day-to-day (or sometimes month to month) fact finding cycle that finds us in a reactionary mindset. Let’s take a look at how each area of Tacoma has shifted over the last two years in the month of October.

PRICE
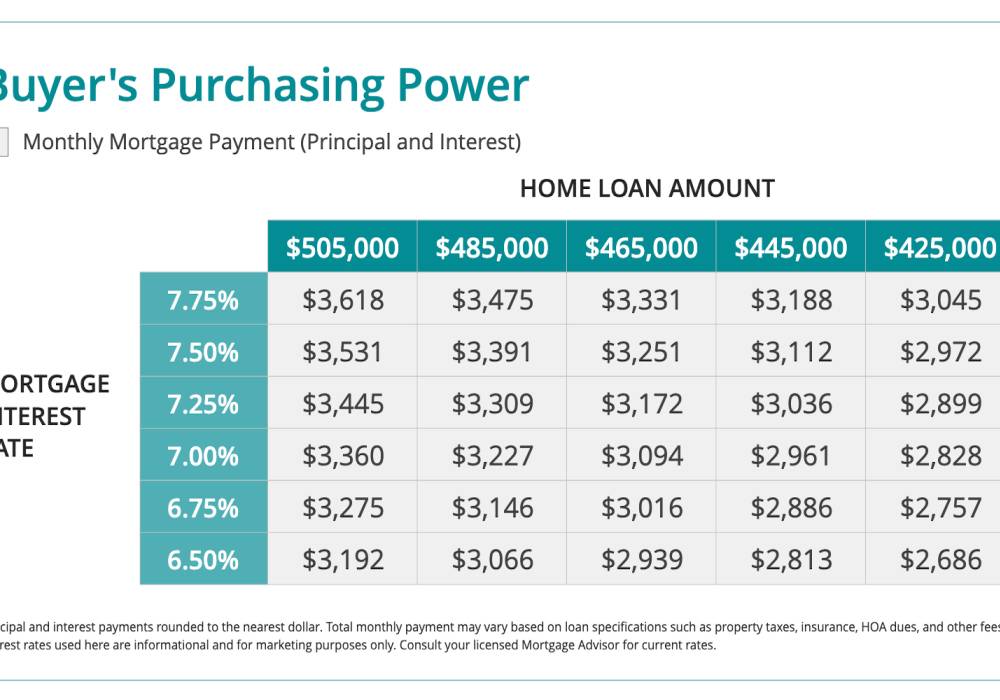
Recently, we have seen home prices drop due to the increase in mortgage rates, and buyer’s spending power decreasing. The result is sellers have had to lower prices overall because as rates have risen, buying power has decreased and there are many buyers who have been priced out. As you can see, the higher the rates go, the lower the price buyers can afford. (Note that this graph is strictly to show the impact of rates versus monthly payments, see your lender for more exact numbers based on number of years, loan type, etc)
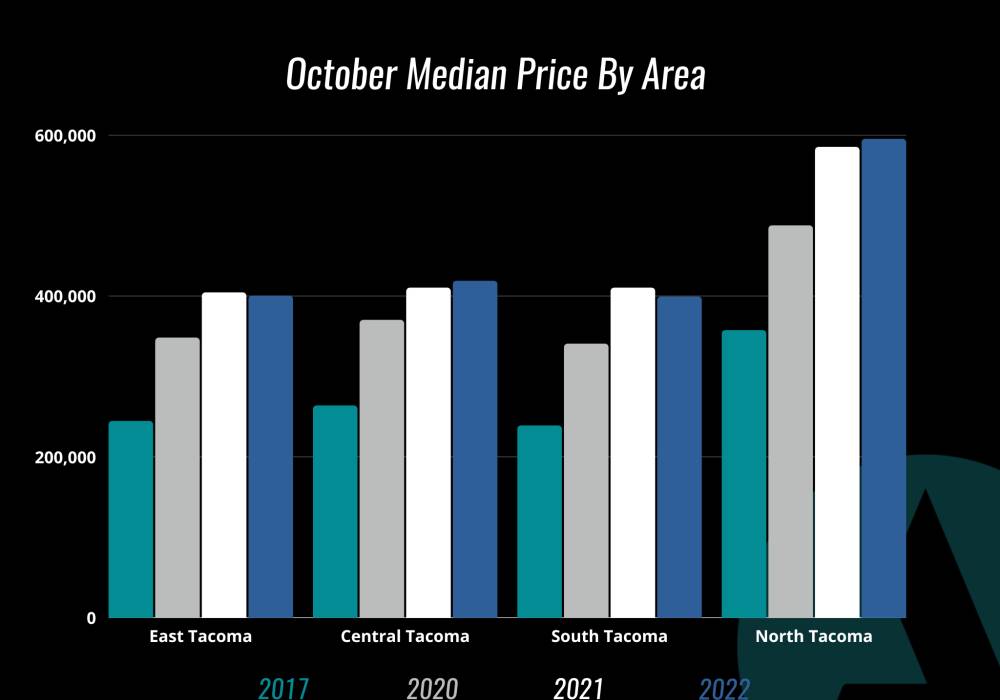
As a result, buyers cannot afford the prices of the last two years, so sellers have had to adjust their pricing. How much have sellers had to adjust in Tacoma over the last 2 to 5 of years? Let’s take a look (last two years and five year mark used for the graph):
Based on the chart, every area in Tacoma is significantly above the 2017 median price. While sellers have been taking a short-term hit on the selling price, long-term we’re still well above the median price. For sellers who purchased 5 or more years ago, they’re sitting on some equity. Even properties purchased in the last 2 years have gained in equity in all areas of Tacoma.
INVENTORY
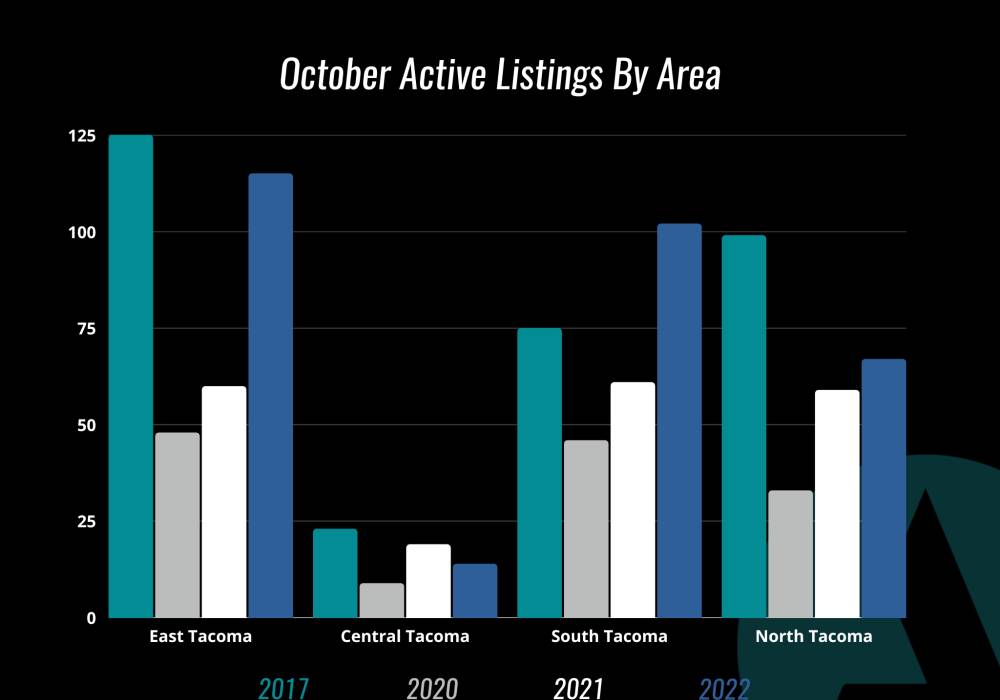
As a result of the rates increasing, we have seen the market move toward a more balanced and healthy market in recent months. Here’s the breakdown of active homes in each area:
As shown in the graph, the inventory dipped heavily in all areas in 2020. East Tacoma almost has reclaimed its 2017 inventory level, while South Tacoma has exceeded it’s 2017 inventory level. Central Tacoma remains a popular area to purchase and/or hold a home, with the lowest amount of inventory between the areas. This is partially due to being a smaller area geographically, but the area has remained consistent in terms of inventory. North Tacoma inventory levels remain significantly lower than 2017 levels. The opportunities to purchase a home remain in East and South Tacoma.
DAYS ON MARKET
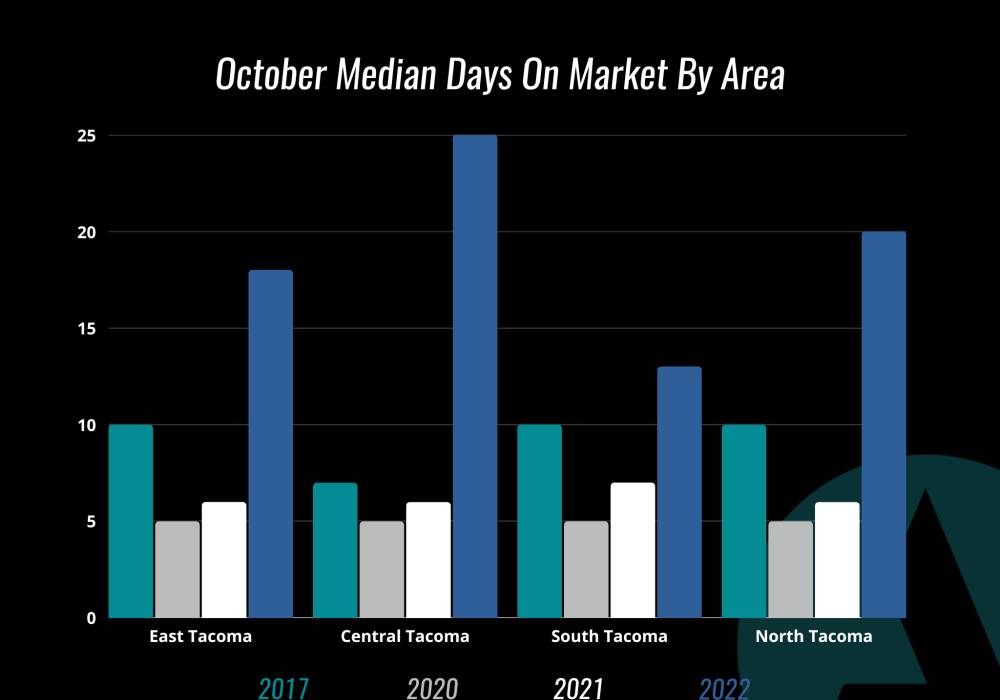
Last, let’s take a look at the amount of days homes have sat on the market in each respective area:
One of the fascinating findings from this graph is while Central Tacoma had the lowest number of active listings, and remained consistent, it has the highest median days on market by a wide margin. This could be due to many extenuating factors, however it could be considered an unexpected finding. South Tacoma has the lowest days on market in the current climate, however that can change based on the October market. Typically, our inventory has decreased in the 4th quarter, however this year we have seen our inventory increase and level off the last couple of months as we head to a more balanced market.
SUMMARY
While the market has slowed down due to the macro economic climate and traditional real estate market cycle, demand to purchase a home in Tacoma persists. The East and Southern areas of Tacoma have the most inventory and opportunity, while Central and North Tacoma remain more in demand.
Each micro-market has it’s own nuances, as does every property within each market. And while it feels like prices have come crashing down, the reality is they’re still up significantly from the last five years, despite what the short-term price correction may feel like.
Every situation is different, every property is different and every market has it’s own nuances. Contact an Abode broker for more information on your local market, we have plenty of information to share!


